ENERGY PERFORMANCE ASSESSMENT FOR EQUIPMENT AND UTILITY SYSTEMS
(CHAPTER-15:ENERGY PERFORMANCE ASSESSMENT OF TEXTILE INDUSTRY)
Introduction
The textile industry in India is one of the largest process industries in terms of its production and employment. Modern textile units are energy intensive requiring both thermal and electrical energy for their operation. The energy cost accounts for about 15 — 20% of the manufacturing cost. A typical energy consumption pattern of a composite textile mill is given in Figure 15.1.
The textile industries with energy consumption equivalent to 3000 MTOE per year and above have been brought under designated consumer category as per Energy Conservation Act in India.
Textile Manufacturing Process
The four major stages of processing is follows as (Figure 15.2)
1.Spinning and weaving process (A)
2.Wet Process (B)
Spinning and weaving
a) Yarn Fabrication
Yarn fabrication is the process, which converts raw fiber into yarn or thread (figure 15.3). The fibers are prepared and then drawn out and twisted to form the yarn, which is then wound onto a bobbin or cone. The yarn fabrication is entirely dry, although some yarns may be dyed and finished as a final customer product
Opening / Blending: Raw materials (cotton and synthetic) are received in compact bales. The traveling type machine removes and separates the compressed fibers from each bale and open into the smallest flock gently. More bales can be processed at a time by this type and thus have long term
blending.
Cleaning: Cotton is passed through a series of machines (beaters) where opening and cleaning takes place simultaneously. Removes strange matters such as plant parts, seed hulls, dirt, etc, from the fibers. Speed of beater and clearance setting may be varied to achieve the desired level of cleaning.
Carding: The fibers are formed into a mat by passing through two press rollers. This mat is continuously fed into the card. The sheet of carded fibers is removed through a funnel into a loose rope like strand called a sliver.
Combing: Processing cotton or wool stock through a series of needles/combs, to remove short fibers and strange matters and to form a sliver of maximum possible evenness.
Drawing: The drawing frame contains number of strands of card sliver and passes them through a set of rollers that rotate at successively faster speed. These rollers combine fibers into a single and more uniform strand. They draw out and lengthen fibers (5-6 times).
Roving: The drawn frame sliver is fed into the drafting arrangement, which attenuate the sliver. The yarn is stretched and slightly twisted to strengthen the strand (8 times the length and 1/8 the diameter).
Spinning: The rove fed into the drafting arrangement is further attenuated and twisted to the desired size to spin into the final yarn. The twist is generated by the spindle, which rotates at a higher speed. Each revolution of spindle imports one turn of twist to the strand. Finally the yarn (twisted fiber strand) is wound on bobbin mounted on spindle with the help of traveler. It uses four types of technologies: Ring spinning, rotor spinning, air jet spinning and friction spinning. Ring spinning is the most used in India due its wide adaptability for spinning different types of yarn. Rotor spinning is also widely used.
b) Fabric Production
Fabric production, the second step, involves weaving / knitting
Weaving : Weaving is the most common method used for producing fabrics. The process is carried out of two sets of threads, which interlaces lengthwise yarns (warp yarns) with widthwise ones (weft or filling yarns).To prevent the warp yarns from braking during weaving,
the warp threads are coated with a size at 80 — 90 °C before weaving, to increase their tensile strength and smoothness. Natural starches are the most commonly used sizes, although compounds such as polyvinyl alcohol (PVA), resins, alkalisoluble cellulose derivatives, and gelatin glue have been used. The sizing compound is dried at 100-130 °C on the threads and remains a part of the cloth until it is removed in the subsequent processes.
Knitting :
In knitting fabric is formed through interlocking series of yarn loops by using hooked needles. Rows of stitches are formed so that each row hangs on the row behind it, usually using sophisticated, highspeed machinery.
Wet Processing
The fabric produced from the weaving or knitting is in rough condition, contains impurities and is often termed ‘grey’ fabric. Fabric processing (wet processing) is done to improve the appearance and serviceability of the fabric. The main operations carried out in this step include pre-treatment, dyeing, printing and finishing (figures 15.4)


Finishing
This stage includes the final operations necessary for making the textile presentable and attractive. It imparts the final aesthetic, chemical and mechanical properties to the fabric as per the end use requirements to improve appearance, texture or quality. The finishing operations include:
Drying: Drying removes the moisture from the fabric using drying machines such as stenter / drying cylinders.
Providing Dimensional Stability: This is one of the most important finishing operations. The fabric,
which is in a distorted condition, is brought to the required dimensions of width and length in a process called heat setting at around 140 - 150 °C. The heating medium used is thermic fluid/steam.
Calendering: A kind of glossy skin is formed on the fabric surface during calendering. The damp fabric is pressed hard against a hot, polished metal surface until it dries.
Softening: After calendering, the fabric becomes a little stiff. Breaking down this stiffness is called softening. The fabric is led through the softening machine so that it touches the studded rollers lightly and drags them around. In this way, the surface of the fabric is lightly disturbed making it much softer. Depending upon the type of fabric to be processed and the final product, any or all of the above processing operations can be carried out.
Monitoring of Energy Consumption in Textile Production Process
The objective of the assessment is to find out the specific energy consumption of both electrical and thermal per kg of yarn or fabric. The main processing areas in textile manufacturing that consume more energy are Spinning and Weaving, Wet Processing, and Garment Manufacturing. In addition, processes not directly related to production such as compressors, humidification systems etc. also consume significant energy.
Assessment of electrical energy consumption in the process
a) Spinning and weaving processes
Determine the processes in spinning and weaving where the largest amount of electricity is used and the data is to be tabulated as per table 15.1.
Table 15.1. Overview of electricity use in Spinning and weaving processing
b) Wet processing
Determine the processes in wet processing where the largest amount of electricity is used and the data
is to be tabulated as per table 15.2.
Table 15.2. Overview of electricity use in wet processing
Assessment of electrical energy consumption in utilities (other than process)
Electrical energy is used up in many areas other than process in the textile plant, including humidification, compressed air systems, lighting systems, electrical distribution network (as _ losses) and other utilities. Each major utility has to be assessed for energy consumption using online energy meters if available or with the portable power analyzer and tabulated as in table 15.3.
Table 15.3. Electrical energy use in other activities
Assessment of overall electrical energy use
After reviewing the main production areas as well as the other company activities, this step is intended to analyse the overall energy use and to calculate associated costs and ratios as shown in table 15.4. bBy comparing the current performance with the previous years or the industries average (benchmarking) it will be possible to identify energy saving opportunities. Since energy use may vary according to capacity utilization, the use of relative indicators, such as (kWh / kg of product) and (total energy costs / overall operating expense) is encouraged. This step will also help to continue with the further development of potential energy-saving changes.
Table 15.4. Overview of total electricity use in textile production
Assessment of overall thermal energy use
Besides electricity, thermal energy carriers such as steam and thermic fluid generated through coal, gas, oil, wood etc., are also used in other processes and activities. The thermal energy is predominantly used in wet processing activities. Since fuels have different calorific values thermal energy used is expressed in Metric Tonnes of Oil Equivalent (MTOE). The format for assessment of overall thermal
energy use is given in table 15.5.
Table 15.5. Total thermal energy use

Assessment of overall energy use
The overall energy use can be calculated from the electricity bills and fuel bills for one year period
and expressed in MTOE as shown in table 15.6.
Table 15.6. Total overall energy in textile production
Benchmarking / Energy Performance Index
The generated data can be further used for benchmarking as shown in table 15.7. In an internal
benchmarking, the current performance can be compared with past values in order to observe the
improvements. External benchmarking will require comparison with industry average or competitors.
The benchmarking parameters commonly used are kWh/kg and kcal/kg of yarn or fabric.
Table 15.7. Benchmarking / Performance Index
Performance Monitoring of Process Equipment
The major energy consuming equipment in textile processes are ring frames, carding, winding and blow room machinery. Since the ring frame is single largest consumer, the performance monitoring is limited to ring frame. Similar approach can be adopted for other equipment. In the wet process the energy intensive equipment are stenters and dyeing machines, performance evaluations of which are given in this chapter.
Performance Evaluation of Ring Frame
The energy consumption depends on yarn count, mix ratio of cotton and polyester, spindle speed, ring diameter, weight of traveler, package diameter, lift, spindle gauge, spindle wharve diameter, type of spindle tape used, front roller speed, maintenance practices of ring frames, type of pneumafil system, motor drive system, etc. The spinning energy performance is reported in terms of kWh consumption per kg of yarn produced at an average reference count. Also there is a convention of reporting specific energy consumption as kWh consumption per spindle shift. Both the figures are bench marked against best practice values and energy saving opportunities implemented accordingly.
Motor Performance Monitoring:
Since the spinning section comprises of large number of motors, load analysis of motors has to be carried out and potential for shuffling, operating in star mode, retrofitting of soft starters energy saver, replacement of motors etc need to be analysed. The procedures described in Chapter-5 may be adopted.
Performance Evaluation of Stenter —Hot Air Dryer
The stenter is a hot air dryer, with the fabric passing through on a chain drive, held in place by either clips or pins. The stenter has many chambers and in each chamber, the air is blown through the radiators in which steam or thermic fluid is passed. The heated air is circulated above and below the fabric and is exhausted to the atmosphere by exhaust fans. Direct firing of natural gas is also practiced in stenters. Apart from drying, the stenter is a versatile piece of equipment used for pulling the fabric to width, chemical finishing, heat setting and curing. Refer figure 15.6 (a & b) for the schematic diagram.
Performance Evaluation Methodology
Efficiency estimation of Stenters/dryers can be done by measurement of moisture content in material before and after the dryer to estimate total moisture removal from the substance. The energy required to drive out this moisture is termed as useful energy spent in the dryer. By measuring the total input heat energy to the dryer, the dryer efficiency is estimated.
Parameters to be measured
Measure moisture content of material at inlet to dryer
Measure moisture content of material at outlet of dryer
Measure mass flow rate of dried material.
Measure input thermal energy to dryer which could be in the form of (i) hot air input (ii)
Steam heating or (111) electrical heating through various direct measurements or indirectly
from quantity of fuel fired and combustion efficiency assessments for direct fuel fired dryers.
Example 15.1
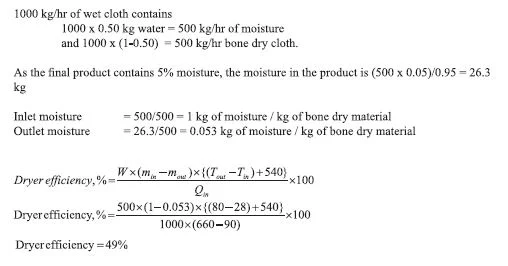
The throughput of a textile stenter is 1000 kg/hr. The inlet moisture content of the cloth is 50% and the outlet moisture is 5%. The inlet and outlet temperature of the cloth is 28 °C and 80 °C. The stenter is supplied with steam at an enthalpy of 660 kcal/kg, the condensate leaves at 90 °C. The flow rate of steam is 1000 kg/hr. Estimate the overall thermal efficiency of the dryer. The latent heat of evaporation of water is 540 kcal/kg.
Performance Evaluation of Dyeing Machines
The different types of machines used in the aqueous dyeing of textile fabrics are open width Jigger dyeing (figure 15.7), Jet dyeing, rope form Winch dyeing etc. These are operated at atmospheric pressure or higher pressure and temperatures below or above 100°C depending on the substrate being dyed. The major energy usage in dyeing is thermal energy in the form of steam. The bath (liquor) ratio may vary from 1:4, 1:6 to 1:10 or higher (1.e.1 kg of textile material to 4, 6 to 10 litres of water on weight ratio) based on the dyeing types (batch / continuous). The dye colour and chemicals are mixed in the water heated by steam.
Effect of material — to — Liquor ratio on consumption of steam Energy requirement for dyeing cotton fabrics
Energy Balance Calculation for dyeing machines
The approach to calculate energy balance is more or less similar to all dyeing machines. Dyeing requires steam to heat the liquor to the requisite temperature and maintain the temperature for a specific period of time.
Energy input is calculated in the following ways:
a) Steam flow rate can be calculated by collecting the quantity of steam condensate for a specified time period.
b) Enthalpy of steam can be drawn from the pressure of steam using steam table/Mollier chart.
Heat Load (at input) = Ms x total enthalpy of steam
Energy output is calculated in the following ways:
a) The heat absorbed by the fabric and vessel.
b) The heat taken by the liquor.
c) The heat through radiation and convection by machine surface
d) Heat in the vapours
*Since the values are insignificant and tedious to calculate, it will be reasonable to assume that fabric and other losses account for additional 10% of the steam input.
Specific consumption of steam in dyeing is calculated as kg of steam per kg of cloth.
Example 15.2. 100 kg of fabric is to be dyed in a jigger. The dye liquor is heated from 30 to 80 °C.
Calculate the quantity of steam required at 2 kg/cm2 (g) and specific steam consumption if the liquor
ratio is 1:6.
Using heat balance equation,
Heat energy input = Heat energy output
Performance Monitoring of Utilities
The major energy utilities of textile industry are:
i. Boilers and steam systems
ii. Thermic fluid heaters
ii. Compressed air systems
iv. Humidification systems
Boiler and Steam Systems
The steam boiler, as a supplier of thermal energy for heating purposes, is the heart of a dye house in wet processing operations. Different fuels are used to operate the steam boilers viz., wood, coal, oil and gaseous fuels based on the cost and availability, calorific value, ease of combustion and flue gas
characteristic.
Refer to chapter-1 of this book for Performance evaluation of boiler (Direct & Indirect method of
efficiency testing) and chapter-3 of book - 2 Steam systems.
Thermic Fluid Heaters
The thermic fluid heaters provide thermal energy for high temperature operations such as drying of fabric in stenter after dyeing operation in wet processing. The drying and finishing of textiles are highly energy intensive processes since it involves the use of very hot air (140-200°C) to either remove chemically held water from the textiles by evaporation or physically /chemically set the textile materials.
Employing petroleum - based fluids as the heat transfer medium, these heaters provide constantly maintainable temperatures for the user equipment.
The modern oil fired thermic fluid heater (refer figure 15.8) consists of a double coil, three pass construction and fitted with modulated pressure jet system. The thermic fluid, which acts as a heat carrier, is heated up in the heater and circulated through the user equipment. There it transfers heat for the process through a heat exchanger and the fluid is then returned to the heater. The flow of thermic fluid at the user end is controlled by a pneumatically operated control valve, based on the operating temperature. The heater operates on low or high fire depending on the return oil temperature, which varies with the system load.
The advantages of these heaters are:
¢ Closed cycle operation with minimum losses as compared to steam boilers.
¢ Non-Pressurized system operation even for temperatures around 250 °C as against 40 kg/cm2
steam pressure requirement in a similar steam system.
¢ Automatic control settings, which offer operational flexibility.
¢ Good thermal efficiencies as losses due to blow down, condensate drain and flash steam do not
exist in a thermic fluid heater system.
Performance Evaluation
Thermic fluid heater efficiency can be tested by the following methods:
1. The Direct Method: Where the energy gain of the working thermic fluid is compared with the energy content of the heater fuel.
2. The Indirect Method: Where the efficiency is the difference between the losses and the energy input. It is also called as heat loss method.
The Direct Method of Testing: This is also known as ‘input-output method’ due to the fact that it needs only the useful output in thermic fluid and the heat input (i.e. fuel) for evaluating the efficiency. This efficiency can be evaluated using the formula
Example 15.3. Test Data and Calculation
Heat output data:
Flow rate of thermic fluid : 68 m3/h
Inlet temperature of thermic fluid =: 200 °C
Outlet temperature of thermic fluid : 212°C
Specific heat of thermic fluid : 2.223 kJ/kg°C
Density of the thermic fluid : 826 kg/m3
Heat input data:
Quantity of fuel oil consumed (Input) : 46 kg/h
GCV of fuel oil : 10000 kcal/kg
Calculation:
Heat output (thermic fluid) = 68 x 826 x (2.223/4.187) x (212-200) = 357902.5 kcal/h
Heat input (fuel) = 46 x 10000 = 460000 kcal/h
Thermic fluid heater efficiency = (357902.5 / 460000) x 100 = 77.8%
(Note: The indirect method for efficiency testing of thermic fluid heater is similar to that for boiler
testing; refer to chapter -1 Boiler, for Indirect Method)
Compressed Air Systems
The intensity of compressed air use is high in spinning section due to automated machines in spinning section. Mostly reciprocating/screw compressors are used. For the performance evaluation of compressed air systems, refer to chapter-8 of this book and chapter-3 of book-3.
Humidification Systems
Need for Humidification: The relative humidity and temperature level needs to be maintained within a prescribed tolerance limits at all steps of textile processing so as to avoid the problems of yarn breakage in dry and brittle condition and also to minimize the build up of static charge so as to reduce dust and fibre fly (fluff). For this purpose, spray air washers using spray water as the medium for adiabatic cooling of air (by direct evaporation of water into the air stream thereby reducing the air’s dry bulb temperature and raising its humidity) are extensively used in humidification systems. The system (figure 15.9) consist of a chamber containing multiple banks of spray headers with spray nozzles, a tank for collecting spray water as it falls and an ‘eliminator section’ with PVC blades having 3 or 4 bends for removing droplets of water from the air which is humidified after passing through the curtain of spray water, before discharge to the air ducts for distribution to the humidified areas.
Psychrometrics of humidification:
The room sensible heat load calculations are worked out as the sum-total of:
¢ Heat dissipation from the machines operating kW load in various departments.
¢ Lighting load
¢ Solar heat gain through insulated roof
¢ Occupancy load
¢ Heat gain from supply air fan motors
Note: For detailed heat load estimation, ASHRAE - HVAC handbook can be referred.
Saturation efficiency
Higher saturation efficiency of air washer is defined as the ratio
Improving the saturation efficiency reduces the temperature of air leaving the air washer thereby increasing the delta ‘T’ (temperature rise of saturated air due to heat pick up in the department) for a specific heat load and relative humidity condition in the department with consequent reduction in required supply air quantity and fan motor power consumption.
Example 15.4.
Temperature of humidified air leaving the air washer based on summer outside design dry bulb (40°C)
and wet bulb temperatures (25°C) and design saturation efficiency (95%) is calculated as follows and
plotted on the psychrometric chart (figure 15.10).
Leaving Air Temperature from Air - Washer
= Entering Air DBT - (Ent. Air DBT - Ent. Air WBT) x % Saturation efficiency
Air temperature leaving the air washer = 40-(40-25) x 0.95 = 40-14.25 = 25.75°C.
With change in ambient air wet bulb temperature, the air-temperature leaving the air washer will also vary along with a change in the department’s inside dry bulb temperature, even though the inside design relative humidity condition remains constant.
The line of supply air temperature rise in the department due to heat gains is plotted horizontally, starting from the point of “leaving air temperature condition” after humidification in air washer, till it reaches the design relative humidity line for the corresponding department.
The required supply air quantity is calculated as follows:
Example 15.5. In a typical spinning mill humidification application, the sensible heat load of the spinning department is estimated as 10,03,000 kcal/h, temperature rise was 8°C and the density and specific gravity of the air were 1.2 kg /Nm3 and 0.24 kcal/kg °C, respectively. Calculate the supply air
quantity for the department.
Humidification design parameters for a typical spinning mill with summer outside design conditions of 40 °C DBT & 25 °C WBT
Performance Evaluation of Fans
The energy consumption in humidification systems is dominated by fans accounting for 90%. Hence any attempt to reduce energy consumption in humidification system depends on efficient operation of fans, optimizing number of air changes, reducing pressure drops in ducting and use of energy efficient fans and motors. For performance evaluation of fans, blowers and duct systems, refer to chapter-6 of this book.
Solved Example:
1) 125 kg of fabric is to be dyed in a jigger. The dye liquor is heated from 30 °C to 90 °C. Calculate steam (steam enthalpy 660 kcal/kg) requirement per batch and specific steam consumption
(kg of steam per kg of cloth), if liquor ratio is 1:6.5; allowing 10% margin for losses.
2) In a textile mill, a thermic fluid heater of 15 lakh kcal/hr capacity is meeting process heat requirements.
The observed parameters of thermic fluid heater are:
Thermic fluid circulation rate - 100 m3./hr
Outlet temperature of fluid - 270 °C
Return temperature of fluid - 256 °C
Specific heat of fluid - 0.55 kcal/kg °C
Density of fluid - 830 kg/m3
Present coal consumption - 300 kg /hr
GCV of coal - 3500 keal/hr
i) What is the % loading of the thermic fluid heater?
11) What is the existing thermal efficiency?
ii1) The management is proposing to add a five chamber, (each chamber | Lakh kcal/hr duty) to the heater. Will it be able to take the load?
------------------------
Chapter 16


Comments