ENERGY_PERFORMANCE_ASSESSMENT_FOR_EQUIPMENT_AND_UTILITY_SYSTEMS_(Chapter 4:Energy Performance Assessment of Heat Exchangers)


ENERGY_PERFORMANCE_ASSESSMENT_FOR_EQUIPMENT_AND UTILITY SYSTEMS

(Chapter 4:Energy Performance Assessment of Heat Exchangers)

Introduction

Heat exchangers are equipment that transfers heat from one medium to another. Shell and tube heat exchangers are used extensively through out the process and power industry and as such a basic understanding of their design, construction and performance is important to the practicing engineer. The proper design, operation and maintenance of heat exchangers will make the process energy efficient and minimize energy losses.

Purpose of the Performance Test

Heat exchanger performance can deteriorate with time, off design operations and other interferences such as fouling, scaling, corrosion etc. It is necessary to assess periodically the heat exchanger performance in order to maintain them at a high efficiency level. This section comprises certain proven techniques of monitoring the performance of heat exchangers, coolers and condensers from observed operating data of the equipment. The objective of performance assessment is to determine the heat exchanger duty, overall heat transfer coefficient, heat exchanger effectiveness, process / utility side pressure drop. Any deviation from the design will indicate occurrence of fouling.

Performance Terms and Definitions

Overall heat transfer coefficient, U

The overall heat transfer coefficient, U, represents how easily the heat can move. A smaller value of U indicates the difficulty in the transfer of heat and vice versa. Heat exchanger performance is normally evaluated by the overall heat transfer coefficient U that is defined by the equation:

When the hot and cold stream flows and inlet temperatures are constant, the heat transfer coefficient may be evaluated using the above formula.

The most commonly used methods for heat transfer analysis are LMTD-F method and the Effectiveness—
NTU method. This section gives an overview of LMTD-F method.

LMTD
The LMTD is Logarithmic Mean Temperature Difference, used to determine the temperature driving force for heat transfer 1n heat exchangers. It is determined by the relationship of the fluid temperature
differences at the terminals of the heat exchanger.

The LMTD Correction Factor, F
If the flow is true counter current, the LMTD calculated is used directly in the basic heat transfer equation. If the flow is not true counter current (1.e., more tube passes than shell passes), LMTD must
be corrected and also to account for cross flow.
In multi-pass shell-and-tube exchangers, the flow pattern is a mixture of co-current and counter current
flow, as the two streams flow through the exchanger in the same direction on some passes and in the opposite direction on others. For this reason, the mean temperature difference is not equal to the logarithmic mean. However, it is convenient to retain the LMTD by introducing a Correction Factor,
F, which is appropriately termed as the LMTD correction factor.

Fouling Factor

One of the important heat-exchanger parameters related to surface conditions is termed as the fouling factor. The fouling factors to be used in the design of heat exchangers are normally specified by the client, based on his experience of running his plant or process to simulate dirt accumulation on the heat transfer surfaces, but if these are not restricted to proper levels, they can totally negate any benefits generated by skillful design. The fouling factor represents the theoretical resistance to heat flow due to a build up of a layer of dirt or other fouling substance on the tube surfaces of the heat exchanger but they are often overstated by the end user in an attempt to minimize the frequency of cleaning. In reality they can, if badly chosen, lead to increased cleaning frequency. The fouling factor increases with increased fouling and causes a drop in the heat exchanger effectiveness. Common types of fouling are chemical, biological, deposition and corrosion fouling.

Industrial Heat Exchangers

The most common types of commercially available heat exchangers are the shell-and-tube exchanger.

Nomenclature

A typical heat exchanger is shown in figure 4.1 with nomenclature.

Heat duty of the exchanger can be calculated either on the hot side fluid or cold side fluid as given
below.
If the operating heat duty is less than design heat duty, it may be due to heat losses, fouling in tubes,
reduced flow rate (hot or cold) etc. Hence, for simple performance monitoring of exchanger, heat duty
may be considered as factor of performance irrespective of other parameter. A deviation in heat duty
may not be a conclusive indicator of fouling due to variation in the process condition. However, the
overall heat transfer coefficient offers itself as a reliable indictor of fouling. Hence the performance
assessment of the heat exchanger is carried out by determination of overall heat transfer coefficient in
the field.

Methodology of Heat Exchanger Performance Assessment
Procedure for determination of Overall heat transfer Coefficient, U

This is a fairly rigorous method of monitoring the heat exchanger performance by calculating the overall heat transfer coefficient periodically. Technical records are to be maintained for all the exchangers, so that problems associated with reduced efficiency and heat transfer can be identified easily. The record should basically contain historical heat transfer coefficient data versus time / date of observation. A plot of heat transfer coefficient versus time permits rational planning of an exchangercleaning program.

The heat transfer coefficient is calculated by the equation

Where Q is the heat duty, A is the heat transfer area of the exchanger and LMTD is temperature driving
force.
The step by step procedure for determination of Overall heat transfer Coefficient is described below.
Step -—A
Monitoring and reading of steady state parameters of the heat exchanger under evaluation are
tabulated as below:

Step —B

With the monitored test data, the physical properties of the stream can be tabulated as required for the evaluation of the thermal data


*MpaS — Mega Pascal Second
Density and viscosity can be determined by analysis of the samples taken from the flow stream at the
recorded temperature in the plant laboratory. Thermal conductivity and specific heat capacity if not
determined from the samples can be collected from handbooks.

Step —C
Calculate the thermal parameters of heat exchanger and compare with the design data

or

Figure 4.2 Temperature Distributions for a Counter and Co-Current Flow Heat exchanger

7. The LMTD Correction Factor, F
The LMTD correction factor is a function of the temperature effectiveness and the number of tube and
shell passes and is correlated as a function of two dimensionless temperature ratios. Let R and P be
the two dimensionless parameters used to calculate LMTD correction factor defined by the equations
below.

Where,
N = Number of shell-side passes
S,  α = Parameters used to calculate LMTD correction factor defined by the equations given above.
8. Corrected LMTD = F x LMTD
9. Overall Heat Transfer Co-efficient
U=Q/(Ax Corrected LMTD)

Heat Exchanger Effectiveness
The heat recovery capability of a heat exchanger is characterized by means of an index referred as the
“Heat Exchanger Effectiveness”, is a measure of thermal performance.

Calculating the heat exchanger effectiveness helps engineers,
¢ To predict how a given heat exchanger will perform a new job.
¢ To predict the stream outlet temperatures without a trial-and-error solution that would otherwise be necessary.

Definition:
“The Heat Exchanger Effectiveness is defined for a given heat exchanger of any flow arrangement as the ratio of the actual amount of heat transferred to the maximum possible amount of heat that could be transferred between the two streams with an infinite area”.

The latter is the rate of heat transfer that would occur in a counter-flow exchanger having infinite heat
transfer area. In such an exchanger, one of the fluid streams will gain or lose heat until its outlet temperature equals the inlet temperature of the other stream.
The fluid that experiences this maximum temperature change is the one having the smaller value of Heat Capacity, C = mass flow rate x specific heat capacity at constant pressure, as can be seen from the energy balance equations for the two streams.
Thus, if the hot fluid has the lower value of C, we will have Tho = Tci and:

Thus, in either case
It should be emphasized that the term effectiveness may not be confused with efficiency. The use of the term efficiency is generally restricted to (1) the efficiency of conversion of energy form A to energy
form B or (2) a comparison of actual system performance to the ideal system performance, under comparable operating conditions, from energy point of view.
Since we deal here with a component heat exchanger and there is no conversion of different forms of
energy in a heat exchanger (although the conversion between heat flow and enthalpy change is present), the term effectiveness is used to designate the efficiency of a heat exchanger. The consequence of the first law of thermodynamics is the energy balance, and hence the definition of the exchanger explicitly uses the first law of thermodynamics.
For air-to-air heat exchangers, when the two streams have the same mass flow (such as the case
of make-up air systems), the expression for the effectiveness referred to as the efficiency) can be
further simplified to:
If the effectiveness of a heat exchanger is 0.5, this does not mean that heat exchanger is only 50% efficient in its transfer of thermal energy. By conservation of energy, any energy that is lost on one side must be gained on the other so in that way we would say them as 100% efficient. But the effectiveness is actually just a measure of the ability of a heat exchanger to exchange temperatures.

If a perfect counter flow heat exchanger should be able to get the two fluids to swap temperatures (assuming the same fluid and mass flow rate). If a = 50 °C air and b = 90 °C air going through a perfect heat exchanger, then we should get a = 90 °C air and b = 50 °C air out of it. 50% effective would give 70 °C air out from both streams.

Examples
a) Liquid — Liquid Exchanger
(1) A shell and tube exchanger of following configuration is considered being used for oil cooler with
oil at the shell side and cooling water at the tube side.

Tube Side
1. 460 Nos x 25.4mmOD x 2.11mm thick x 7211mm long
2.Pitch —31.75mm 30° triangular
3.2 Pass

Shell Side
1. 787mm ID
2. Baffle space — 787 mm
3.1 Pass
The monitored parameters are as below:

5. Temperature Range Cold Fluid


6. LMTD
7. LMTD Correction Factor, F, to account for Cross flow:
Computing the Parameters below:
8. Corrected LMTD = F x LMTD = 0.977 x 85.9 = 83.9 C.
9. Overall Heat Transfer Co-efficient

Comparison of Calculated data with Design Data
Heat Duty: Actual duty differences will be practically negligible as these duty differences could be
because of the specific heat capacity deviation with the temperature. Also, there could be some heat
loss due to radiation from the hot shell side.

Pressure drop: Also, the pressure drop in the shell side of the hot fluid is reported normal (only slightly
less than the design figure). This is attributed with the increased average bulk temperature of the hot
side due to decreased performance of the exchanger.

Temperature range: As seen from the data the deviation in the temperature ranges could be due to the
increased fouling in the tubes (cold stream), since a higher pressure drop is noticed.

Heat Transfer coefficient: The estimated value has decreased due to increased fouling that has resulted in minimized active area of heat transfer.
Physical properties: If available from the data or Lab analysis can be used for verification with the
design data sheet as a cross check towards design considerations.
(ii) In the above example 4.6(a), determine the Effectiveness of heat exchanger and Heat Capacity
ratio.
Hot fluid, Coil = (W x Cph) oil = (719800 x 2.847) / 3600 = 569.24 kW/ °C.
Cold fluid, Cwater = (w x Cpc) water = (881150 x 4.187) / 3600 = 1024.83 kW/°C.
Therefore,
Cmin = 569.24
Cmax = 1024.83
Q = 24477.4kW
ΔTmax = 145- 25.5 = 119.5°C
b) A Plate Heat Exchanger with total heat transfer area of 41 m2 is used to exchange heat between a
hot effluent stream and cooling water stream.
The monitored parameters are given below:
Calculate LMTD and Overall heat transfer coefficient, U, assuming LMTD correction factor of 0.9
for plate heat exchanger. Specific heat capacity of hot effluent stream is 4.187 kJ/kg°C.
Solution
Hot Load, Q = (85200 x 4.187 x (77-54)) / 3600 = 2279 kW.
LMTD, Counter flow = {(77-57) — (54-49)}/ {In (77-57) / (54-49)}
= 10.8°C
Correction Factor, F = 0.9 (given)
Corrected LMTD =FxLMTD
=0.9 x 10.8 =9.72°C
Overall heat transfer coefficient, U = Q / (A x Corrected LMTD)
U = 2279 / (41 x 9.72) = 5.718 kW/m2. °C

c) A double pipe heat exchanger is used to cool a hot stream from 177° C to 121° C by heating a cold
stream from 49° C to 77° C. The hot stream will flow in the inner pipe in a counter flow arrangement
to the cold stream in the outer pipe.
The heat transfer surface area of 18.5 m? will transfer the heat load of 1025.85 kW. Determine the
overall heat transfer coefficient, U.
Solution
LMTD, Counter flow = {(177-77) — (121-49)}/ {In (177-77) / (121-49)}
                                   = 85.2°C
Overall heat transfer coefficient, U =Q/(Ax LMTD)
                                                         = 1025.85 / (18.5 x 85.2)
                                                         = 0.651 kW/m2 °C
d) Surface Condenser
A shell and tube exchanger of following configuration is considered being used for Condensing turbine
exhaust steam with cooling water at the tube side.
Tube Side
20648 Nos x 25.4mmOD x 1.22mm thk x 18300mm long

Pitch — 31.75mm 60° triangular
1 Pass
The monitored parameters are as below:
Heat Duty: Actual duty differences will be practically negligible as these duty differences could be
because of the specific heat capacity deviation with the temperature. Also, there could be some heat
loss due to radiation from the hot shell side.
Pressure drop: The condensing side operating pressure raised due to the backpressure caused by the
non-condensable. This has resulted in increased pressure drop across the steam side.
Temperature range: With reference to cooling waterside there is no difference in the range however,
the terminal temperature differences has increased indicating lack of proper heat transfer.
Heat Transfer coefficient: Heat transfer coefficient has decreased due to increased amount of noncondensable with the steam.
Trouble shooting:
Operations may be checked for tightness of the circuit and ensure proper venting of the system. The
vacuum source might be verified for proper functioning.

Solved Example:
4. Energy Performance Assessment of Heat Exchangers
Flow rates of the hot and the cold water streams flowing through a heat exchanger are 12 and 30 kg/
min, respectively. Hot and cold water stream inlet temperatures are 72 °C and 27 °C, respectively. The
exit temperature of the hot stream is required to be 52 °C. The specific heat of water is 4.179 kJ/kg K.
The overall heat transfer coefficient is 800 W/m2 K.
Neglecting the effect of fouling, calculate the heat transfer area for
a) Parallel-flow
b) Counter-flow
Solution:


------------------------

ENERGY_PERFORMANCE_ASSESSMENT_FOR_EQUIPMENT_AND_UTILITY_SYSTEMS_(Chapter 3:Energy Performance Assessment of Cogeneration Systems With Steam & Gas turbine)


ENERGY_PERFORMANCE_ASSESSMENT_FOR_EQUIPMENT_AND UTILITY SYSTEMS

(Chapter 3:Energy Performance Assessment of Cogeneration Systems With Steam & Gas turbine)

Introduction

Cogeneration systems can be broadly classified as those using steam turbines, Gas turbines and DG sets. Steam turbine cogeneration systems involve different types of configurations with respect to mode of  power generation such as extraction, back pressure or a combination of backpressure, extraction and condensing.

Gas turbine with heat recovery steam generators is another mode of cogeneration. Depending on power and steam load variations in the plant the entire system is dynamic. A performance assessment would yield valuable insights into cogeneration system performance and need for further optimization.

Purpose of the Performance Test

The purpose of the cogeneration plant performance test is to determine the power output and plant heat rate. In certain cases, the efficiency of individual components like steam turbine is addressed specifically where performance deterioration is suspected. In general, the plant performance will be compared with the base line values arrived at for the plant operating condition rather than the design values. The other purpose of the performance test is to show the maintenance accomplishment after a major overhaul. In some cases the purpose of evaluation could even be for a total plant revamp.

Performance Terms and Definitions

Overall Plant Performance

Steam Turbine Performance
Gas Turbine and Heat Recovery Steam Generator Performance

Reference Standards

ASME performance test codes

Field Testing Procedure

The test procedure for each cogeneration plant will be developed individually taking into consideration the plant configuration, instrumentation and plant operating conditions.

Test Duration

The test duration is site specific and in a continuous process industry, 8-hour test data should give reasonably reliable data. In case of an industry with fluctuating electrical/steam load profile, a set of 24-hour data sampling to be taken for a representative period.

Measurements and Data Collection

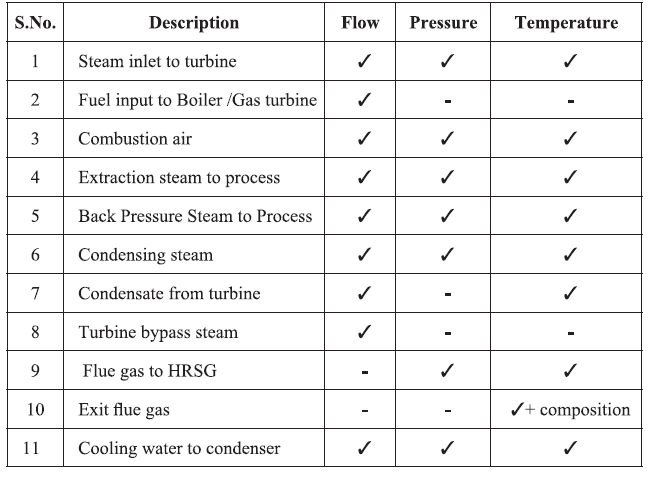
The suggested instrumentation (online/ field instruments) for the performance measurement is as under:

Steam flow measurement : Orifice flow meters 

Fuel flow measurements : Volumetric measurements / Mass flow meters

Air flow / Flue gas flow : Venturi / Orifice flow meter / Ion gun / Pitot tubes

Flue gas analysis : Zirconium Probe Oxygen analyser

Unburnt analysis : Gravimetric analysis

Temperature : Thermocouple

Cooling water flow : Orifice flow meter / weir /channel flow/

non-contact flow meters

Pressure : Bourdon Pressure Gauges

Power : Trivector meter / Energy meter

Condensate : Orifice flow meter

It is essential to ensure that the data is collected during steady state plant running conditions. Among others the following are essential details to be collected for cogeneration plant performance evaluation.

I. Thermal Energy:


II. Electrical Energy:

1. Total power generation for the trial period from individual turbines.

2. Hourly average power generation

3. Quantity of power import from utility ( Grid )

4. Auxiliaries power consumption

Calculations for Steam Turbine Cogeneration System

The process flow diagram for cogeneration plant is shown in Figure 3.1. The following calculation procedures have been provided in this section.

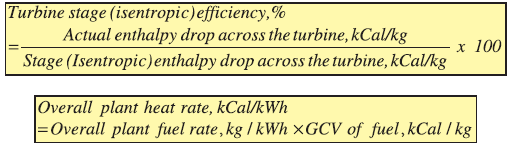
1.Turbine cylinder efficiency

2.Overall plant heat rate

Step 1:
Calculate the actual heat extraction in turbine at each stage,
Steam Enthalpy at turbine inlet : H1 kcal/kg
Steam Enthalpy at 1“ extraction : H2 kcal/kg
Steam Enthalpy at Condenser : H3* kcal / kg
* Due to wetness of steam in the condensing stage, the enthalpy of steam cannot be considered as equivalent to saturated steam. Typical dryness value is 0.88 — 0.92. This dryness value can be used as first approximation to estimate heat drop in the last stage. However it is suggested to calculate the last stage efficiency from the overall turbine efficiency and other stage efficiencies.

Heat extraction from inlet :                                    H1- H2 kCal/kg
to extraction
Heat extraction from :                                            H2— H3 kCal / kg
Extraction to condenser

Step 2:
From Mollier diagram (H-f Diagram) estimate the theoretical heat extraction for the conditions
mentioned in Step 1. Towards this:
a) Plot the turbine inlet condition point (H,) in the Mollier chart — corresponding to steam
pressure (P,) and temperature.
b) Since expansion in turbine is an adiabatic process, the entropy is constant. Hence draw a
vertical line from inlet point (parallel to y-axis) upto the extraction pressure (P,). Read the
corresponding enthalpy H, ,..
c) Plot the extraction condition point (H,) in the Mollier chart — corresponding to steam
pressure (P,) and temperature.
d) Draw a vertical line from extraction point (parallel to y-axis) upto the condensing pressure
(P,). Read the corresponding enthalpy H3-i8
e) Compute the theoretical heat drop for different stages of expansion.

Step 3:

Compute turbine stage (isentropic) efficiency

Step 4:
To calculate the turbine power output (Pt)
Step 5:
To calculate the generator power output (Pg)
Examples
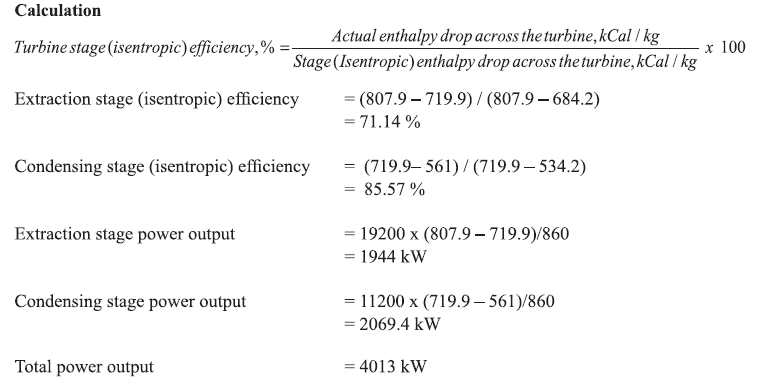
Example 3.6.1
From the data given for an extraction condensing turbine, calculate the stage-wise (isentropic) turbine
efficiency and power output.


Example 3.6.2
Calculate the following performance parameters of the gas turbine, details of which are given below
1. Overall plant fuel rate
2. Overall plant heat rate
3. Thermal efficiency of HRSG
4. Energy Utilisation Factor (EUF)
1. Determination of overall plant fuel rate
Fuel consumption = 1312 Sm3/hr
Electrical power output = 3994.5 kW
Overall plant fuel rate = 1312/3994.5
= 0.32844 Sm?/kWh

2. Overall plant heat rate
Overall plant heat rate, kCal/kWh
=Overall plant fuel rate, Sm3 /kWhxGCV of fuel, kCa/ lSm ?
= 0.32844 x9465
= 3109 kCal/kWh

3. Thermal efficiency calculations for HRSG

Case Study of Bottoming Cycle Cogeneration in a Cement Industry
Waste heat sources in a cement plant
In cement manufacturing process, raw materials are burnt in the Rotary Kiln and the fuel used for combustion generates huge quantity of exhaust gases. A part of the heat in the flue gas is utilized for pre heating the raw materials going to kiln in preheaters. Along with this the heat in flue gas is also used remove the moisture of coal (used as fuel) and limestone (main raw material for cement production) during grinding. Further the heat may also be used to dry Puzzolonic materials such as fly ash or slag used in the manufacture of blended cement.
Based on the number of preheater stages, kiln gases exit at around 300 — 400°C in case of 4 stage preheater and 200 — 300°C in case of 5 — 6 stage pre-heater. The quantity of heat from pre-heater exit gases ranges from 180-250 kcal/kg clinker.
The solid material i.e. clinker coming out of the rotary kiln is at around 1000 °C and is cooled to 100- 120 °C temperature using ambient air in clinker cooler. This generates hot air of about 200-300 °C having heat of 80-130 kcal/kg clinker. Part of the hot air generated is used as combustion air in kiln furnaces & remaining is exhausted to atmosphere.
Waste gas discharged from Kiln Preheater and clinker cooler thus contains useful energy that can be converted into power by installation of waste heat boiler that runs a steam turbine. The generation potential depends on the Kiln capacity, number of pre-heater stages, heat required to remove moisture in raw material and coal.

Waste heat recovery based power generation
The waste heat recovery (WHR) system, effectively utilises the available waste heat from exit gases of pre-heater and clinker cooler. The WHR system consists of Suspension pre-heater (SP) boiler, Air Quenching Chamber (AQC) boiler, steam turbine generator, distributed control system (DCS), water-circulation, system and dust-removal system etc as shown in Figure 3.3
Process requirements decide the output temperature of flue gas from the waste heat recovery boilers thus deciding available heat to be recovered. Seasonal variations in the demand of flue gas for drying raw material also to be met while designing the system.

Calculation of power generation potential

1. Kiln capacity: 4300 Tons per Day (179.167 Tons Per Hour)

2. No of stages in the preheater: 5

3. Preheater exit gas details:

Volume (mph): 167559 Nm3/hr

Specific heat capacity (Cph) : 0.355 kcal/kg/ Deg C

Inlet Temperature T: 295 Deg C

Outlet temperature with WHRB: 195 Deg C

4. Cooler exit gas details:

Volume (mc) : 91000 Nm3/hr

Specific heat capacity (Cc) : 0.316 kcal/kg/ Deg C

Inlet Temperature T: 360 Deg C

Outlet temperature with WHRB: 130 Deg C

5. Overall Conversion efficiency —Pre heater section: 20%

6. Overall Conversion efficiency- Cooler section: 21 %

Calculations:


Solved Example:

A common plant facility is installed to provide steam and power to textile and paper plant with a cogeneration system. The details and operating parameters are given below:


Other data:

- Turbine, alternator and other losses = 8%

- Specific steam consumption in paper industry= 5 Tons/Ton of paper

- Specific power consumption in paper industry= 600 kWh/Ton of paper

Calculate:

i. Coal consumption in boiler per hour or per day.

il. Power generation from co-generation plant

iil. If 10% is auxiliary power consumption in co-generation plant, how much power is consumed

by the textile industry per hour?

iv. What is the gross heat rate of turbine?


ii) Gross power generation from co-generation plant

Total enthalpy input to turbine = 60,000 x 810 = 48.6 Million kcal.

Total enthalpy out put through back pressure = 60,000* 660 = 39.6 Million kcal

Enthalpy difference = 48.6- 39.6 =9 Million kcal/hr

Turbine, alternator and other losses (8%) = 9x0.08 = 0.72 Million kcal/hr

Useful energy for power generation = 9 - 0.72 = 8.28 Million kcal/hr

Power generation from co-generation plant = 8.28 x 10°/860 = 9628 kWh

il) If 10% is auxiliary power consumption in co-generation plant, power consumed by textile

industry

10% of total power generation = 9628 x 0.10 = 962.8 kWh

Total power consumed by industries = 9628 — 962.8 = 8665.2 kWh

Total steam consumption in paper plant 40 tons/hr. and specific steam consumption 5 ton/ton

of paper. So Paper production per hour is 8 tons.

Specific power consumption = 600kWh/ton.

Total power consumption in paper industry = 8 x 600 = 4800kWh

Total power consumption in textile industry = 8665.2- 4800 = 3865.2 kWh

iv) Gross heat rate =Input enthalpy — Output enthalpy/ Gross generation

= (48.6- 39.6) 10°/ 9628 

= 934.7 keal/kWh

-----------------------

Chapter 2

Chapter 4

ENERGY_PERFORMANCE_ASSESSMENT_FOR_EQUIPMENT_AND_UTILITY_SYSTEMS_(Chapter 2:ENERGY PERFORMANCE ASSESSMENT OF FURNACES)


ENERGY_PERFORMANCE_ASSESSMENT_FOR_EQUIPMENT_AND UTILITY  SYSTEMS

(Chapter 2:ENERGY PERFORMANCE ASSESSMENT OF FURNACES)

Industrial Heating Furnaces

A heating furnace is by definition a device for heating materials and therefore a user of energy. Heating furnaces can be divided into batch-type (Job at stationary position) and continuous type (large volume of work output at regular intervals). The types of batch furnace include box, bogie, cover, etc. For mass production, continuous furnaces are used in general. The types of continuous furnaces include pusher-type furnace (Figure 2.1), walking hearth-type furnace, rotary hearth and walking beam-type furnace. (Figure 2.2)

The primary energy required for reheating / heat treatment (say annealing) furnaces are in the form of Furnace oil, LSHS, LDO or electricity


Purpose of the Performance Test
* To make a heat balance of the furnace
*To find out the efficiency of the furnace
* To find out the specific energy consumption
The purpose of the performance test is to determine various losses, efficiency of the furnace and specific energy consumption for comparing with design values or best practice norms. There are many factors affecting furnace performance such as capacity utilization of furnaces, excess air ratio, final heating temperature etc. Performance test is the key for assessing current level of performances and finding the scope for improvements and productivity.

Reference Standards
In addition to conventional methods, Japanese Industrial Standard (JIS) GO702 “Method of heat balance for continuous furnaces for steel” is used for the purpose of establishing the heat losses and efficiency of reheating furnaces. The standard has been simplified to suit practical calculation in the industry.

Performance Terms and Definitions

Furnace Heat Balance Method
Heat balance helps us to numerically understand the present heat loss and efficiency and improve the
furnace operation using these data. Thus, preparation of heat balance is a pre-requirement for assessing
energy conservation potential. The methodology ofa typical furnace heat balance is given simultaneously along with an example 2.6.
The total heat input is provided in the form of fuel or power. The desired output is the heat supplied
for heating the material or process. Other heat outputs in the furnaces are undesirable heat losses. The
inputs and outputs are calculated on the basis of per tonne of stock/charge.
The major losses that occur in the fuel fired furnace (Figure 2.3) are listed below. 
1. Heat lost through exhaust gases either as sensible heat or as incomplete combustion
2. Heat loss through furnace walls and hearth 
3.Heat loss to the surroundings by radiation and convection from the outer surface of the walls
4.Heat loss through gases leaking through cracks, openings and doors.

imilar to the method of evaluating boiler efficiency by indirect method, furnace efficiency can also be calculated from heat balance. Furnace efficiency is calculated after subtracting sensible heat loss in flue gas, loss due to moisture in flue gas, heat loss due to openings in furnace, heat loss through furnace skin and other unaccounted losses from the heat input to the furnace.

In order to carry out a heat balance, various parameters that are required are hourly oil consumption, material output, excess air quantity, temperature of flue gas, temperature of furnace at various zones,skin temperature and hot combustion air
temperature.
The energy absorbed by the material requires the use of specific heat which can be obtained from reference manual/data book.
If the process requires a change in state, from solid to liquid, or liquid to gas, then in addition to sensible heat, an additional quantity of energy is required called the latent heat of fusion or latent heat of evaporation and this quantity of energy needs to be added to the total energy requirement.
Measurement Parameters
The following are some of the key measurements to be made for working out the energy balance in
oil fired reheating furnaces.
i) Weight of stock / Number of billets heated
ii) Temperature of the stocks/billets
iii) Temperature of furnace walls, roof etc
iv) Area of furnace walls, roof etc
v) Flue gas temperature
vi) Flue gas analysis
vii) Fuel oil consumption
Instruments like infrared thermometer, fuel consumption monitor, surface thermocouple and other measuring devices are required to measure the above parameters. Reference manual should be referred
for data like specific heat, humidity etc.

Furnace Efficiency
The efficiency of a furnace is the ratio of useful heat output to heat input. The direct determination of
furnace efficiency is carried out as follows.
Heat inthe stock
Heat inthe fuel consumed
Thermal efficiency of the furnace =
The quantity of heat to be imparted (Q) to the stock can be found from the formula
Where,
Q = Quantity of heat in kcal
m = Weight of the material in kg
C, = Mean specific heat, kcal/kg °C
t, = Final temperature desired, °C
t, _ Initial temperature of the charge before it enters the furnace, °C

Example: Heat Balance of Furnace
An oil-fired reheating furnace has an operating temperature of around 1340°C. Average fuel consumption
is 400 litres/hour. The flue gas exit temperature after air preheater is 655 °C. Air is preheated from ambient temperature of 40°C to 190°C through an air pre-heater. The furnace has 460 mm thick wall (x) on the billet extraction outlet side, which is | m high (D) and | m wide. Draw a heat balance to identify heat losses, efficiency and specific fuel consumption. The other data are as follows.
Flue gas temperature after air preheater = 655 °C
Ambient temperature = 40 °C
Abs. humidity = 0.03437 kg/kg dry air
Preheated air temperature = 190°C
Specific gravity of oil = 0.92
Average fuel oil consumption = 400 Litres / hr
= 400 x 0.92 =368 kg/hr
O, in flue gas = 12%
CO, in flue gas = 6.5%
CO in flue gas = 50 ppm
Weight of stock = 6000 kg/hr
Specific heat of Billet = 0.12 kcal/kg °C
Surface temperature of ceiling = 85 °C
Surface temperature of side walls = 100 °C
Surface temperature of flue duct = 64 °C
Area of ceiling = 15 m2
Area of side walls = 36 m2
Area of flue duct = 10.3 m2
Diameter of flue duct = 0.4m
Furnace oil constituents (% by weight)
Carbon - 85.9 %, Hydrogen -12%, Oxygen - 0.7%, Nitrogen - 0.5%, Sulphur - 0.5%, H,O - 0.35%,Ash - 0.05%, GCV- 10,000 kcal/kg

1) Calculation of air quantity and specific fuel consumption


5) Efficiency of furnace
=(1,56,000 / 6,13,300) x 100
=25.4 %
Factors Affecting Furnace Performance
The important factors, which affect the efficiency, are listed below for critical analysis.
« Under loading due to poor hearth loading and improper production scheduling
«  Improper design
« Use of inefficient burner
« Insufficient draft/chimney
« Absence of waste heat recovery
« Absence of instruments/controls
« Improper operation/maintenance
« High stack loss
« Improper insulation /refractories

Useful Information
Radiation Heat Transfer
Heat transfer by radiation is proportional to the fourth power of absolute temperature. Consequently
the radiation losses increase considerably as temperature increases.

In practical terms this means the radiation losses from an open furnace door at 1500°C are 11 times
greater than the same furnace at 700°C. A good incentive for the iron and steel melters is to keep the
furnace lid closed at all times and maintaining a continuous feed of cold charge onto the molten bath.

Furnace Utilization Factor
Utilization has a critical effect on furnace efficiency and is a factor that is often ignored or underestimated. If the furnace is at temperature then standby losses of a furnace occur whether or not a
product is in the furnace.
Standby Losses
Energy is lost from the charge or its enclosure in the way of heat: (a) conduction, (b) convection; or/ and (c) radiation
Furnace Draft Control
Furnace pressure control has a major effect on fuel fired furnace efficiency. Running a furnace at a slight positive pressure reduces air ingress and can increase the efficiency.
Scale
Scale is the flaky material formed on the surface due to oxidation of iron/steel at high temperature in the presence of excess air. This results in loss of material and hence useful output.

Data Tables
Table — I: Co-efficient based on the profile of furnace openings (φ)


Calculation of mean specific heat


Solved Example:
In oil fired furnace following are the operating parameters:
Capacity of furnace - 10 T/hr
Daily production operating at 10 hours a day - 100 T/day
Specific fuel consumption - 65 litres /T of finished product
Flue gas temperature at the exit of furnace - 600 °C
Ambient temperature - 30°C
G.C.V of oil - 10,000 kcal/kg
Theoretical air required for combustion - 14 kg of air/ kg of fuel
Specific heat of flue gas - 0.26 kcal/kg°C
Specific heat of air - 0.24 kcal/kg°C
Oxygen in flue gas - 8%
The management is planning to install a recuperator to preheat the combustion air upto 200°C.
Yield without the recuperator - 90%
Yield after installing the recuperator - 95%

Calculate:
(1) the percentage heat reduction in flue gas after installation of recuperator
(ii) the increase in daily production due to yield improvement
(iii) specific fuel consumption after installing the heat recovery recuperator (assuming | % fuel
saving for every 20°C rise in combustion air temperature)

-------------


Followers