GENERAL_ASPECTS_OF_ENERGY_MANAGEMENT_AND_ENERGY_AUDIT
(CHAPTER 10:ENERGY EFFICIENCY AND CLIMATE CHANGE)
Energy and Environment
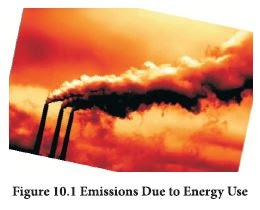
The combustion of hydrocarbon based fuels in industrial activity generates by-product materials, many of which are considered to be air pollutants (Figure 10.1). The principal emissions which impact on the air environment are carbon dioxide, particulate matter (dust), sulphur oxides, nitrogen oxides, hydrocarbons, and carbon monoxide. Particulate matter is predominantly generated during the combustion of solid fuels such as coal, lignite, biomass etc mostly from ash content in the fuel. Sulphur oxide (SOx) emissions mainly occur from combustion of oil and coal due to sulphur content in the fuel. Nitrogen oxides (NOx) emissions are also associated with fuel combustion, both from fuel as well as combustion air. Both SOx and NOx emissions have been identified as major air pollutants globally as they lead to acid rain which is a trans-boundary environmental issue. The main sources of carbon monoxide emissions are due to incomplete combustion of fuels.
Carbon dioxide resulting from the oxidation of carbon in fuels during combustion dominates the total emissions. Although, carbon dioxide is not considered as a pollutant, it is considered as a major contributor to global warming and climatic change.
Global Environmental Issues
One of the most important characteristics of global environmental issues is that it affects all mankind on a global scale without regard to any particular country or region. These environmental issues have global significance and need to be addressed through international efforts. The whole world is a stakeholder and this raises issues on who should do what to combat environmental problems.
Some of the key environmental issues of global significance are
1. Acid rain
2. Ozone layer depletion
3. Global warming and climatic change
4. Loss of biodiversity
Acid Rain
Acid rain is caused by release of sulphur oxides and nitrogen oxides from combustion of fossil fuels, which then mix with water vapour in atmosphere to form sulphuric acids and nitric acids respectively (Refer Figure 10.2).
The effects of acid rain are as follows:
1.Acidification of lakes, streams, and soils
2. Direct and indirect effects (release of metals, for example: Aluminum which washes away plant nutrients)
3. Killing of wildlife (trees, crops, aquatic plants, and animals)
4. Decay of building materials and paints, statues, and sculptures
5. Health problems (respiratory, burning- skin and eyes)
Ozone Layer Depletion
Ozone layer is a thin layer of ozone (O,) present in stratosphere which extends from 10-50 km from the earth (Figure 10.3). The ozone layer is highly beneficial to life on earth as it blocks the sun’s Ultraviolet radiations (UV-B) from reaching the earth. Any disturbance or depletion of ozone layer would result in an increase of harmful radiation reaching the earth’s surface leading to dangerous consequences.
Ozone, which is highly unstable, is produced and destroyed naturally in the stratosphere and until recently, this resulted in a well-balanced equilibrium (see Figure 10.4). Ozone is formed when oxygen molecules absorb ultraviolet radiation with wavelengths less than 240 nanometres and is destroyed when it absorbs ultraviolet radiation with wavelengths greater than 290 nanometres.
Ozone Depletion Process
In recent years, scientists have measured a seasonal thinning of the ozone layer primarily at the South Pole. This phenomenon is being called the ozone layer depletion. It was found that ozone is easily broken down by man-made chlorine and bromine compounds. These compounds are found to be responsible for most of the ozone layer depletion. The main chemical responsible for the problem is identified as Chloro fluro carbons (CFCs) which were used in refrigerator and air conditioners.
The ozone depletion process begins when Chloro fluro carbons (CFCs) and other ozone-depleting substances (ODS) emitted into the atmosphere reach stratosphere by diffusion. Strong UV radiations break apart the ODS molecules. CFCs, HCFCs, carbon tetrachloride, methyl chloroform release chlorine atoms, and halons and methyl bromide release bromine atoms. It is the chlorine and bromine atom that actually destroys ozone, not the intact ODS molecule. It is estimated that one chlorine atom can destroy from 10,000 to 100,000 ozone molecules before it is finally removed from the stratosphere.
Chemistry of Ozone Depletion
When ultraviolet light waves strike CFC (CFCI,) molecules in the upper atmosphere, a carbonchlorine bond breaks, producing a chlorine (Cl) atom. The chlorine atom then reacts with an ozone (O3) molecule breaking it apart and so destroying the ozone. This forms an ordinary oxygen molecule (O2) and a chlorine monoxide (ClO) molecule. Then a free oxygen atom breaks up the chlorine monoxide, releasing chlorine. The released chlorine is free to repeat the process of destroying more ozone molecules. A single CFC molecule can destroy 100,000 ozone molecules. The chemistry of ozone depletion process is shown in Figure 10.5.
Effects of Ozone Layer Depletion
Effects on Human and Animal Health: Increased penetration of solar UV-B radiation is likely to have high impact on human health with potential risks of eye diseases, skin cancer and infectious diseases. Effects on Terrestrial Plants: Increased radiation is likely to change species composition in forest and grassland thus altering the bio-diversity in different ecosystems. It could also affect the plant community indirectly resulting in changes in plant form, secondary metabolism, etc.
Effects on Aquatic Ecosystems: High levels of radiation exposure in tropics and subtropics may affect the distribution of phytoplanktons, which form the foundation of aquatic food webs. It can also cause damage to early development stages of fish, shrimp, crab, amphibians and other animals, the most severe effects being decreased reproductive capacity and impaired larval development.
Effects on Bio-geo-chemical Cycles: Increased solar UV radiation could affect terrestrial and aquatic bio-geo-chemical cycles thus altering both sources and sinks of greenhouse and important trace gases, e.g. carbon dioxide (CO,), carbon monoxide (CO), carbonyl sulfide (COS), etc. These changes would contribute to biosphere-atmosphere feedbacks responsible for the atmosphere build-up of these greenhouse gases.
Effects on Air Quality: Reduction of stratospheric ozone and increased penetration of UV-B radiation result in higher photo dissociation rates of key trace gases that control the chemical reactivity of the troposphere. This can increase both production and destruction of ozone and related oxidants such as hydrogen peroxide, which are known to have adverse effects on human health, terrestrial plants and outdoor materials.
Ozone Depletion Counter Measures
International cooperation and agreement was signed at Montreal Protocol in 1974 to phase out ozone
depleting chemicals. The ozone depletion counter measures include,
¢ Tax imposed on use of ozone depleting substances
¢ Use of ozone friendly substitutes- HCFC and HFC (less ozone depleting potential and shorter life)
¢ Recycle of CFCs and Halons
Global Warming and Climatic Change
The atmosphere is a thin layer of gas which surrounds the Earth. The two most important layers in the atmosphere are known as the troposphere and the stratosphere. The air layer gets thinner and thinner with altitude. 90% of all the molecules in the atmosphere are in the troposphere. The atmosphere is composed mainly of 21% Oxygen, 78% Nitrogen, 0.04% carbon dioxide, and Argon 0.04% by volume. In addition, water vapour and several gases are present in very small amounts.
The Greenhouse Effect
The earth is surrounded by a blanket of gases including greenhouse gases. The greenhouse gases are those gases in the atmosphere which by absorbing thermal radiation emitted by the earth’s surface have a blanketing effect over the surface keeping it warmer than it would otherwise be. This results in build up of energy, and the overall warming of the atmosphere. This blanket traps energy in the atmosphere, much the same way as glass traps heat inside a greenhouse. Without naturally occurring greenhouse gases such as water vapour, carbon dioxide, methane and nitrous oxide, the earth’s average surface temperature would be a cold -18°C rather than the tolerable 15°C. This warming of the earth called the greenhouse effect (Figure 10.6) is a natural process which made life on Earth possible.
The Earth’s atmosphere allows short-wave solar radiation from sun to pass relatively unimpeded. The long-wave infrared radiation emitted from the warm earth’s surface is partially trapped and re-emitted downwards by greenhouse gases such as water vapour, carbon dioxide, methane, Nitrous oxide, in the upper atmosphere. In this way an energy balance is set up, which ensures that the Earth is warmer than it would be without it.

Enhanced Greenhouse Effect
The natural greenhouse effect is enhanced (Figure 10.6) by the increase of greenhouse gases in the atmosphere especially carbon dioxide from burning of fossil fuels, coal, oil and gas, together with wide deforestation over the past 200 years and more substantially over the past 50 years.
Although, water vapour is also considered as greenhouse gas, its amount in the atmosphere is not changing directly because of human activities. The other important greenhouse gases that are directly influenced by human activities leading to enhanced greenhouse effect are carbon dioxide, methane, nitrous oxide, the chlorofluorocarbons (CFCs) and ozone. There is now overwhelming evidence that
enhanced greenhouse effect from human activities is changing the global climate. It is estimated that the earth’s average temperature has risen by 0.75°C since 1880 because of emissions of greenhouse gases from human activity. The relation between CO, and global temperature variations is shown in Figure 10.7.
Greenhouse Gases
Carbon Dioxide: Carbon dioxide is the most important of the greenhouse gases because of its abundance in the atmosphere. The increase in carbon dioxide has contributed to about 60% of the enhanced greenhouse effect as its concentration of 397 ppm (Mauna Loa Observatory: November, 2014 data) is much higher than other greenhouse gases. It is also persistent with atmospheric lifetime of over 100 years.
Man-made Carbon Dioxide Emissions: The major source of CO, is fossil-fuel combustion (coal, petroleum, and natural gas). For the same amount of heat released, natural gas emits the least CO2. Coal-based power plants are the major CO, sources in many countries in the world. Among the industrial processes, cement is a major contributor of CO, as emissions occur from both fuel combustion and calcination of limestone.
Petroleum-burning motor vehicles are another major contributor of CO, emissions. Deforestation contributes too because when felled trees are burned, their stored carbon is released as CO2. At the same time, deforestation leaves fewer trees to take up atmospheric CO2.
Carbon Sequestration: It is the term given to the process of removing CO2 from large point sources
such as power plant, oil refineries, industrial process etc. The CO2 is then stored in geologic formations such as depleted oil and gas reservoirs, deep coal seams or saline reservoirs. Oceans are a major CO2 sink, containing about 50 times more carbon than the atmosphere. Terrestrial biomass including trees and grasses store about three times more Co2 than the atmosphere. Together, ocean and terrestrial ecosystems absorb about half the excess CO2 generated by human activities.
Methane: The main natural source of methane is from wetlands. Methane is also created when organic matter such as food and vegetables decompose without presence of oxygen- a process called anaerobic decomposition.
Anthropogenic sources include leakage during coal mining, leakage from natural gas pipelines and from petroleum wells, rice cultivation, belching from cattle and other livestock, decay of municipal solid wastes dumped in landfill sites and from wood burning.
Methane is a naturally occurring inflammable gas. Methane is produced by geological coal formations and by the decomposition of organic matter. Leading anthropogenic sources of methane are landfills, livestock digestive processes and wastes, especially ruminants (cud-chewing animals) and wetland rice cultivation.
Nitrous Oxide: The emissions to the atmosphere that are associated with human activities are from use of nitrogen fertilizer, manure, biomass combustion, fossil fuel combustion in power plant and the chemical industry (for example. nylon production). Also, N,O is contained in soil by bacteria. When farmers plow the soil and disturb the surface layer, N,O is released into the atmosphere. It is also released from catalytic converters in cars. It has an atmospheric lifetime of about 120 years.
Ozone: Ground-level ozone is a greenhouse gas. It can absorb infrared radiation and contribute to warming. Ground-level ozone forms from Volatile Organic Compounds (VOCs) and nitrogen oxides in the presence of heat and the sun’s ultraviolet radiation.
Chlorofluorocarbons (CFCs): The CFCs are man-made chemicals which vaporise just below room temperature and are non-toxic and non-flammable. CFC contains chlorine atoms and has been used in industry as refrigerants, cleaning solvents, manufacturing of insulation and propellants in spray cans.
They are so chemically unreactive and once released into the atmosphere, they remain for a long time of about 100 or 200 years before being destroyed.
As an outcome of Montreal Protocol, CFCs are phased out, being replaced by other halocarbonshydrochlorofluorocarbons (HCFCs) and hydrofluorocarbons (HFCs). While HCFC and HFC are less destructive to ozone than the CFCs, they are still considered as greenhouse gases.
Because of their shorter lifetime, and lower concentrations, their contribution to global warming for a given rate of emission, will be less than for the CFCs. However, since their rate of manufacture could increase substantially their potential contribution to global warming is being included alongside other greenhouse gases.
The main sources of Hydroflurocarbons are leakage from refrigeration equipment, release during end of life destruction of equipment, use of HFC containing aerosols, air conditioners etc. These are best contained by recycling the refrigerants.
Perflurocarbons: Perfluorcarbons is also considered as an important greenhouse gas as it has a long atmospheric life, more than several thousand years. All emissions of these gases accumulate in the atmosphere and will continue to influence climate for thousands of years.
Primary aluminum production and semiconductor manufacture are the largest known man-made sources of perfluorocarbons.
Sulphur Hexafluoride (SF): Sulfur hexafluoride is the most potent greenhouse gas. It is used in insulation, electric power transmission equipment, the magnesium industry, semiconductor manufacturing to create circuitry patterns on silicon wafers, and as a tracer gas for leak detection.
Global Warming Potential (GWP)
The different types of greenhouse gases all have different properties. For example, the amount of time they reside in the atmosphere and the amount of heat that they trap can vary widely. Many of the greenhouse gases are extremely potent—some greenhouse gases such as sulphur hexafluoride can continue to reside in the atmosphere for thousands of years after they have been emitted.
Some greenhouse gases are 140 to 23,900 times more potent than CO, in terms of their ability to trap and hold heat in the atmosphere over a 100-year period. Even though these gases represent a very small proportion of the atmosphere, their enormous heat-holding potential makes them significant and represents a serious addition to global warming.
In order to understand specific greenhouse gases’ potential impact, they are rated on the basis of their global warming potential (GWP). The GWP of a greenhouse gas is the ratio of global warming—or radiative forcing—from one unit mass of a greenhouse gas to that of one unit mass of CO, over a period of time, making the GWP a measure of the “potential for global warming per unit mass relative to carbon dioxide.” In other words, greenhouse gases are rated on how potent they are compared to CO2
GWPs take into account the absorption strength of a molecule and its atmospheric lifetime. Therefore, if methane has a GWP of 23 and carbon has a GWP of | (the standard), this means that methane is 23 times more powerful than CO, as a greenhouse gas. The higher the GWP value, the larger the infrared absorption and the longer the atmospheric lifetime. As shown in Table10.1, even small amounts of sulfur hexafluoride and HFC-23 can contribute a significant amount to global warming. The increasing concentration of greenhouse gases, GWP and lifetime is given in Table 10.1.
Global Greenhouse Gas Emissions
Since the Industrial Revolution, annual CO, emissions from fuel combustion dramatically increased from near zero to almost 36 Giga tonnes of CO, in 2013. Among the many human activities that roduce greenhouse gases, the use of energy represents by far the largest source of emissions.
Smaller shares correspond to agriculture, producing mainly CH, and N,O from domestic livestock and rice cultivation, and to industrial processes not related to energy, producing mainly fluorinated gases and N,O. Within the energy sector, CO, resulting from the oxidation of carbon in fuels during combustion dominates the total GHG emissions. CO, from fossil fuels & cement contributes almost 70% of global GHG emissions (Figure 10.8).

India’s Greenhouse Gas Emissions
India contributed to almost 7% of global emissions and is now third largest contributor in terms of
CO, emissions behind China and USA. Although, India’ emitted about 2.5 Giga tonnes of carbon
dioxide in 2013, the per capita emissions is still low at 1.6 tonnes per annum. Coal-based power
production, accounted for almost 70% of all of India’s coal-related CO, emissions.
Global Warming and Climatic Change Impacts
There is strong evidence now that most of the observed warming over the last 50 years is caused by human activities. Climate models predict that the global temperature will rise by about 6 °C by the year 2100. The major impacts of global warming are as follows:
Increasing Ocean Temperature and Rising Sea Levels During the twentieth century, observations show that the average sea level increased by about 20 cm.
The largest contribution to this rise is from thermal expansion of ocean water as the oceans warm the water expands and the sea level rises. A further increase in average sea level of 10 to 20 cm by 2030 and up to 1 m by 2100 is predicted. The coastal flooding will increasingly occur with rising sea level. People, who are already poor and overcrowded, may be forced from homes in low-lying countries such as Bangladesh. Even developed countries such as the Netherlands may lose land. Since half of the world populations live near the coastal zones, their vulnerability to rising sea levels are very high.
Snow and Ice Melting
Ice is already melting worldwide, especially at the earth’s poles. This includes mountain glaciers, ice sheets covering West Antarctica and Greenland, and Arctic sea ice. Snow and ice melting would also lead to rising sea levels. Also melting ice caps will disturb the ocean ecosystem. Fresh water from melting ice caps would desalinate the oceans and eco systems will be put out of balance and ocean currents which regulate the temperatures will be disturbed. Also cooling property of white ice caps which reflect heat back into space is lost further warming the earth.
Over the past 150 years, the majority of mountain glaciers monitored have been shrinking. Many glaciers at lower latitudes are now disappearing, and scientists predict that the majority of glaciers will be gone by the year 2100. As glaciers continue to shrink, summer water flows will drop sharply, disrupting an important source of water for irrigation and power in many areas that rely on mountain watersheds. Monitoring of Himalayan glaciers indicates that recession of some glaciers has occurred in some regions though not consistently across entire mountain chain.
Altered Rainfall Patterns
Rainfall patterns would be altered, with some areas getting more rainfall and others suffering more droughts. On warmer days, more water evaporates from soil and trees into the air leading to more clouds and rainfall. But moisture can also evaporate from dry soils, depriving them of already limited moisture.
A trend of increasing rainfall has been found along the west coast, northern Andhra Pradesh while decreasing monsoon rainfall trend has been observed over north-eastern India and some parts of Gujarat and Kerala.
Extreme Weather Events
Already, cyclones, storm, hurricanes are occurring more frequently and floods and draughts are more intense than before. This increase in extreme weather events are not considered as random events. Computer models predict this trend towards more powerful storms and hotter, longer dry periods. States of West Bengal, Gujarat and Kerala have reported increasing extreme weather trends.
More Severe Heat Waves
Heat waves and periods of unusually warm weather are already happening and are expected to increase with global warming. Already many cities in India are experiencing increasing heat waves due to global warming.
Temperatures that people from a hotter climate consider normal can be termed a heat wave in a cooler area if they are outside the normal pattern for that area. Severe heat waves have caused catastrophic crop failures, thousands of deaths from heat stroke, and widespread power blackouts due to increased use of air conditioners.
Loss of Biodiversity
Ecosystems will change - some species will move farther north or become more successful; others would not be able to move and could become extinct. Most of the world’s endangered species (some 25 per cent of mammals and 12 per cent of birds) may become extinct over the next few decades as warmer conditions alter the forests, wetlands, and rangelands they depend on, and human development blocks them from migrating elsewhere. The oceans, which are source of great biodiversity, would also be affected. For example the coral reefs, which have limited tolerance for warm waters would be severely affected.
Increased Diseases
Diseases currently restricted to existing hot regions may move into the newly warming regions. Malaria is one such disease, spread by mosquito vectors, infecting and killing millions each year in warm climates. As temperature increases in currently temperate regions, mosquitoes and other insects are expected to move in, spreading diseases as they go. In addition, indigenous disease organisms previously killed by winter cold will be better able to survive milder winters.
Dwindling Freshwater Supply
A higher sea level also means salty water can infiltrate fresh groundwater in coastal areas reducing the supply and also making it undrinkable. This is a major concern, since billions of people on earth already lack access to freshwater. Higher ocean levels already are contaminating underground water sources in many parts of the world. Climate change is projected to decrease water availability in many aridand semi-arid regions. One third of the world’s population is now subject to water scarcity
Food Shortages
Food production needs to double to meet the needs of an additional 3 billion people in the next 30 years. Water resources will be affected as precipitation and evaporation patterns change around the world. This will affect agricultural output. Climate change 1s projected to decrease potential crop yields in the tropics and sub-tropics for almost any amount of warming. Food security is likely to be threatened and some regions are likely to experience food shortages and hunger.
International Agreements: United Nations Framework Convention on Climate Change (UNFCCC)
The United Nations Framework Convention on Climate Change (UNFCCC) was signed by over 160 countries at the United Nations Conference on Environment and Development held at Rio de Janeiro in June 1992 came into force from 1994.
It has set the agenda for action to slow and stabilize climate change. The signatories to the Convention recognized the reality of global warming and agreed that action to mitigate the effects of climate change needs to be taken and that developed countries should take the lead in this action.
The Convention mentions a short-term and one far-reaching objective. The short term objective aim is that developed countries should take action to return greenhouse gas emissions, in particular, those of carbon dioxide to their 1990 levels by the year 2000.
The long-term objective of the Convention is that the concentrations of greenhouse gases in the atmosphere should be stabilized ‘at a level which would prevent dangerous anthropogenic interference with the climate system’, the stabilisation to be achieved within a time-frame sufficient to allow ecosystems to adapt naturally to climate change to ensure that food production is not threatened and to enable economic development to proceed in a sustainable manner.
The Intergovernmental Panel on Climate Change (IPCC)
The IPCC, the Intergovernmental Panel on Climate Change, was formed in 1988 by the World Meteorological Organization and the United Nations to review climatic data and periodically report on their findings.
Scientists with the Intergovernmental Panel on Climate Change (IPCC) concluded in a 1995 report that the observed increase in global average temperature over the last century “is unlikely to be entirely natural in origin” and that the balance of evidence suggests that there is a “discernible human influence on global climate.” Several of their conclusions are summarized below:
¢ Atmospheric greenhouse gases continue to increase as a result of human activities.
¢ The fraction of warming due to carbon dioxide exceeds 50%.
¢ Decreases of about 10% in snow cover have occurred since the late 1960s.
¢ Reductions in the year’s duration of lake and river ice cover occurred in the twentieth century.
¢ Increases in the heat contained in the world’s oceans have occurred since the late 1950s
¢ Between 0.1 and 0.2 m rise in global average sea levels occurred in the twentieth century.
The panel projects that, if current trends continue, increases in atmospheric greenhouse gases in the
twenty-first century will result in an average global temperature increase between 1.4 and 5.8°C. About 75% of the warming is expected to be due specifically to carbon dioxide. They also project sea-level rises of another 0.1 to 0.9 m.
The 1995 IPCC report greatly altered the world’s view of climate change, and led to the 1997 Kyoto
Protocol, an international agreement among industrialized nations to modestly reduce emissions of greenhouse gases.
Conference of Parties (COP)
The COP is the “supreme body” of the Convention. The Parties to the United Nations Framework Convention on Climate Change (UNFCCC) meet annually in form of COP. The primary task is to promote and review the implementation of the Convention and any related legal instruments (such as the Kyoto Protocol, etc.). Countries that have joined the UNFCCC are referred to as “Parties to the Convention”. The meetings held between each COP are known as Intersessional meetings.
The landmark COP is COP 3 which resulted in Kyoto Protocol in 1997. The Kyoto Protocol includes legally binding emission targets for developed countries (Annex I Parties) for the six major greenhouse gases, which are to be reached by the period 2008-2012.
The Kyoto Protocol
The Kyoto Protocol is an international agreement linked to the United Nations Framework Convention on Climate Change.The major feature of the Kyoto Protocol is that it sets binding targets for 37 industrialized countries and the European community for reducing greenhouse gas (GHG) emissions. This amounts to an average of five per cent against 1990 levels over the five-year period 2008-2012.
Recognizing that developed countries are principally responsible for the current high levels of GHG
emissions in the atmosphere as a result of more than 150 years of industrial activity, the Protocol places a heavier responsibility on developed nations under the principle of “common but differentiated
responsibilities.”
The Kyoto Protocol entered into force on 2005 when Russia signed the protocol. All the participating countries have ratified the protocol other than United States. USA which contributes to almost 25% of global greenhouse gases has not yet ratified the protocol citing reasons that protocol has failed to include binding targets and timetables for developing countries such as China and India and that US economy would be seriously harmed.
Kyoto Protocol Reductions
Parties to the Kyoto Protocol wanted flexibility in how they could pursue reductions in greenhouse
gas emissions. They spent great amounts of time discussing flexibility mechanisms, ways by which a nation could take credit for reducing emissions. Flexibility mechanisms are intended to supplement not replace direct actions by a country or company such as conserving fossil fuel.
Targets
The targets cover emissions of the six main greenhouse gases, namely:
1.Carbon dioxide (CO2)
2.Methane (CH4)
3. Nitrous oxide (N2O)
4.Hydrofluorocarbons (HFCs)
5. Perfluorocarbons (PFCs)
6. Sulphur hexafluoride (SF6)
The maximum amount of emissions (measured as the equivalent in carbon dioxide, CO,e) that a Party
may emit over the commitment period in order to comply with its emissions target is known as a Party’s assigned amount. The individual targets for Annex I Parties as per Kyoto Protocol are listed in Table 10.2.
* The 15 States who were EU members in 1990 will redistribute their targets among themselves, taking advantage of a scheme under the Protocol known as a “bubble’’, whereby countries have different individual targets, but which combined make an overall target for that group of countries. The EU has already reached agreement on how its targets will be redistributed.
** Some EITs (Economies In Transition) have a baseline other than 1990.
*** The US has indicated its intention not to ratify the Kyoto Protocol.

The Kyoto Protocol Mechanisms
Parties with commitments under the Kyoto Protocol have accepted targets for limiting or reducing greenhouse gas emissions. These targets are expressed as levels of allowed emissions, or “‘assigned amounts,” over the 2008-2012 commitment periods.
Under the Treaty, countries must meet their targets mainly through national measures. The Kyoto Protocol also offers them an additional means of meeting their targets by way of three market-based mechanisms. The Kyoto mechanisms are:
¢ Emissions trading — also known as “the carbon trading”
¢ Clean development mechanism (CDM)
¢ Joint implementation (JI).
The mechanisms help stimulate green investment as well as help Parties meet their emission targets
economically.
Emission Trading
Emissions trading allow countries that have emission units to spare - emissions permitted to them but not “used” - to sell this excess capacity to countries that are over their targets. Emission trading is also known as carbon trading since carbon dioxide 1s the principal greenhouse gas. Carbon 1s now tracked and traded like any other commodity. This is known as the “carbon market.”
Clean Development Mechanism (CDM)
The Clean Development Mechanism (CDM) allows a country with an emission-reduction under the Kyoto Protocol to implement an emission-reduction project in developing countries. Such projects can earn saleable certified emission reduction (CER) credits, each equivalent to one tonne of CO2 which can be counted towards meeting Kyoto Protocol targets. The mechanism results in sustainable development and emission reductions, while giving industrialized countries some flexibility in how they meet their emission reduction or limitation targets. The major CDM projects have been from renewable energy followed by waste handling and disposals.
Joint Implementation (JI)
The mechanism known as “joint implementation,” allows a country with an emission reduction under the Kyoto Protocol to earn emission reduction units (ERUs) from an emission-reduction or emission removal project in another Annex I country, each equivalent to one tonne of CO2, which can be counted towards meeting its Kyoto target. A JI project must provide a reduction in emissions by sources, or an enhancement of removals by sinks, that is additional to what would otherwise have occurred. Joint implementation offers Parties a flexible and economic means of fulfilling a part of their Kyoto commitments, while the host Party benefits from foreign investment and technology transfer.
The difference between JI-projects and CDM-projects is that JI-projects are done between countries that both have commitments, while the CDM-projects is between one country that has commitments and another country that does not have commitments. Emissions reductions that have been done through CDM-projects during the period 2000 to 2007 can be used for fulfilling commitments in Annex I countries for the period 2008-2012.
CDM Methodology and Procedure
Project Cycle for CDM
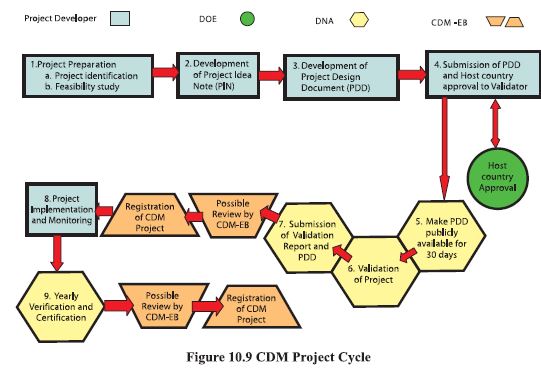
The various stages of the project cycle for CDM are shown in Figure 10.9. Of these, last three stages are performed throughout the life cycle of the project. Project Preparation: The first step in the CDM project cycle is the identification and formulation of potential CDM Projects. This can be done by comparing potential projects against the list of already approved methodologies available with UNFCCC. This step establishes that the CDM project is real, measurable and additional.
Potential CDM projects include,
Zero emission renewables — grid-connected electricity generation for renewable sources.
Biomass — grid-connected electricity from biomass.
Waste — landfill gas project activities.
Animal waste — change of animal waste management activities.
Cement — increasing the blend in cement production.
Energy efficiency
Small scale CDM projects include type | (renewable energy), type II (energy efficiency
improvements), and type III (other projects)
The CDM project developer is advised to carry out a technical and economic feasibility study of the project. This is not a requirement for the CDM project application, but it helps to prove the additionality of the project and gives clear information of Return on Investment with and without CDM. Depending on what the feasibility study covers, it can also facilitate the preparation of the Project Idea Note and the Project Design Document.
Development of Project Idea Note (PIN): If the results of the pre-screen and feasibility study are positive, the developer and/or their advisors should develop a Project Idea Note, or PIN. Although a PIN is not required for CDM application, it helps to inform the Designated National Authority (DNA) of the host country about the project and obtain feedback about the country’s specific sustainability requirements. The PIN also can be used to get feedback from potential carbon credit buyers in the marketplace about their level of interest, prior to going through the entire CDM process. The PIN will subsequently be screened by the recipient entities against the CDM rules and their investment criteria.
PIN consists of approximately five pages providing indicative information on:
¢ Type and size of the project;
¢ Location of the project;
¢ Anticipated total amount of GHG reduction compared to the “business-as-usual’ scenario (which will be explored further in the Project Design Document);
¢ Suggested crediting life time;
¢ Suggested CER price (in US$/tCO, equivalent reduced)
¢ Financial structuring (indicating which parties are expected to finance the project; and
¢ Project’s other socio-economic or environmental effects/ benefits.
Development of Project Design Document: The PDD is the key document in the CDM cycle. The PDD is mandatory and is submitted to a Designated Operational Entity (DOE) for validation, and subsequently to the CDM Executive Board for registration before CERs are issued.
The baseline methodology and the baseline scenario are essential elements of PDD as these are used to calculate the amount of CER’s that are generated by the project. The baseline methodology outlines how baseline emissions are determined and baseline scenario determines the actual emissions before project implementation. Project proponents can either use an existing methodology to calculate the baseline for this kind of projects or choose to develop a new methodology.
Another central issue in CDM projects is from when, and for how long, the project will generate CER (also known as the crediting period). For almost all CDM projects, carbon credits are counted from the date that the project starts, and resulting in GHG emission reduction. For some rare CDM projects where CDM project had already started and been registered only afterwards, carbon credits are counted only from the date of registration as a CDM project.
The second question is for how long the project will be considered to generate CER. In principle this is for as long as the project fulfills the CDM requirements (and most importantly among these, that there are no new and more attractive technologies or projects that could replace the project on commercial grounds and generate even less GHG). This could become a very complicated issue to prove, and to make things easier, projects can either be valid for one period of ten years only, or for up to three periods of seven years each, but with revalidation of the project every seventh year.
The completed PDD along with the required reports has to be submitted to the DNA in the host country for approval. Host country approval of CDM projects is essential to ensure that governments retain sovereignty over their natural resources and their ability to mitigate emissions. The DNA’s responsibility is to review and approve the proposed project under CDM and to confirm whether the project meets the host country’s sustainable development criteria.
Host Country Approval: The National CDM Authority in the non-Annex I nation evaluates and approves the project and serves as a point of contact. Together with the investor, the host country developer must prepare a Project Design Document (PDD). National CDM Authority in India is Ministry of Environment & Forest (MoE&F)
Validation / Registration of Project: The PDD and host country approval documents are submitted to
an accredited DOE for review and validation. The DOE initiates the validation process by making PDD publicly available for comments by parties, stakeholders and UNFCCC accredited observers for 30 days. After 30 days, DOE prepares a report with verbal and written comments explaining how the
comments have been responded. Subsequently, the DOE undertakes a validation process of the CDM
project.
¢ This involves evaluating the PDD and associated documents against the requirements for CDM to confirm that all the information and assumptions made are accurate and reasonable.
¢ Validation occurs at the outset of a project and is distinct from verification, which occurs during the operation of the project.
Finally, the DOE submits the PDD, host country approval, and validation report to the CDM-Executive
Board for registration of the project. It is recommended that the project developer requests the DOE for a copy or confirmation of the request for registration.
Registration of the project with the CDM Executive Board is the act of formal acceptance of the validated project. The registration of the project with the Executive Board will be final after a aximum
of eight weeks after submission, unless the CDM EB decides to request a review.
Once the project has been registered, it can be implemented. However, since CERs can also accrue from the point of validation, certain projects are implemented prior to registration.
Project Implementation and Monitoring: Carbon funds are available through
¢ International tenders for CDM projects
¢ Voluntary corporate initiatives
¢ Multilateral Funds
¢ EU commitments for carbon purchase
¢ Bilateral negotiations with the consortium of buyers
The public funding for CDM projects must not result in the diversion of funds for official development
assistance (ODA). The CERs generated by CDM projects will be subject to 2% levy, to help particularly
vulnerable developing countries adapt to the adverse effects of climate change. Once the project is operational, the project participants have to monitor the project’s performance according to the procedures laid out in the validated monitoring plan of the PDD. Monitoring report is prepared including an estimate of CERs generated.
Monitoring is not a one time activity. It is continued for the entire duration of crediting period (7 years x 3 or 10 years). At the very minimum, technical project performance has to be monitored, including project output and related GHG emissions, environmental impact and leakage. The leakages are indirect emissions increases or decrease outside the defined the project boundaries such as changed consumer behaviour or reduced transport.
Verification: Verification is the periodic review and ex-post determination of the monitored GHG emission reductions that have occurred as a result of the CDM project.The DOE verifies that the datacollectedby the developer are accurate and complete and have been collected in accordance with the monitoring plan. Verified GHG emission reductions from the CDM project form the basis for CERs. CERs are based on actual reductions during the specific time period for which the monitoring results are provided,which is usually one year.
An operational entity will verify that the CERs have resulted according to the guidelines and conditions agreed upon during the initial validation of the project. Subsequently, verification is carried out on an annual basis through the selected DOE. Refer Figure 10.10.
Certification and Issuance of CER: The operational entity provides a certification report that gives written assurance that a project achieved the reduction as verified. Unless a project participant or three Executive Board members request a review within 15 days, the CERs are issued.
However, current demand for CERs is low. A number of Annex I countries are not participating in the Kyoto Protocol or its second commitment period. In addition, approximately two-thirds of the present quantitative limit set by the European Union Emissions Trading System for the use of emission reduction units (ERUs) and CERs has already been used. Therefore currently confirmed demand is not nearly sufficient to accommodate the current supply capacities of the mechanism.
Requests for issuance have also declined though less significantly, primarily because the marginal cost of requesting issuance is relatively low in comparison with the costs of developing, implementing, and registering a project. Nevertheless, rates of issuance requests are well below the peak levels of 2011 and 2012 and may be expected to remain low in light of the current demand levels.
European Union’s Efforts to Combat Climate Change
The 2020 Climate and Energy Package (EU)
The climate and energy package is a set of binding legislation which aims to ensure the European Union meets its ambitious climate and energy targets for 2020.
These targets, known as the “20-20-20” targets, set three key objectives for 2020:
¢ A 20% reduction in EU greenhouse gas emissions from 1990 levels;
¢ Raising the share of EU energy consumption produced from renewable resources to 20%;
¢ A 20% improvement in the EU’s energy efficiency.
The 20-20-20 targets represent an integrated approach to climate and energy policy that aims to combat climate change, increase the EU’s energy security and strengthen its competitiveness. These targets were set by EU leaders in March 2007, when they committed Europe to become a highly energyefficient, low carbon economy, and were enacted through the climate and energy package in 2009.
The EU Emissions Trading System (EU ETS)
The EU emissions trading system (EU ETS) is a policy tool evolved by European Union to combat climatic change by reducing industrial greenhouse gas emissions cost-effectively. The EU ETS covers more than 11,000 power stations and industrial plants in 31 countries, as well as airlines.
A ‘Cap and Trade’ System
The EU ETS works on the ‘cap and trade’ principle. A ‘cap’, or limit, is set on the total amount of certain greenhouse gases that can be emitted by the factories, power plants and other installations in the system. The cap is reduced over time so that total emissions fall.
Within the cap, companies receive or buy emission allowances which they can trade with one another as needed. They can also buy limited amounts of international credits from emission-saving projects around the world. The limit on the total number of allowances available ensures that they have a value.
After each year a company must surrender enough allowances to cover all its emissions, otherwise heavy fines are imposed. If a company reduces its emissions, it can keep the spare allowances to cover its future needs or else sell them to another company that is short of allowances. The flexibility that trading brings ensures that emissions are cut where it costs least to do so.
In 2020, emissions from sectors covered by the EU ETS will be 21% lower than in 2005. By 2030,
the Commission proposes, they would be 43% lower.
Sustainable Development
According to the Bruntland Commission Report “Our Common Future” presented in 1987, sustainable development is ‘meeting the needs of the present without compromising the ability of future enerations to meet their own needs’.
A more detailed definition:
“Sustainable development means living on the Earth’s income rather than eroding its capital’ and ‘keeping the consumption of renewable natural resources within the limits of their replenishment’ It recognizes the intrinsic value of the natural world explaining that sustainable development ‘means handing down to successive generations’ not only manmade wealth (such as buildings, roads and railways) but also natural wealth, such as clean and adequate water supplies, good arable land, a wealth of wildlife and ample forests’.
Sustainable development encompasses three basic and inter-related objectives:
¢ Economic security and prosperity
¢ Social development and advancement
¢ Environmental sustainability
Sustainable development demands that we seek ways of living, working and being that enable all people of the world to lead healthy, fulfilling, and economically secure lives without destroying the environment and without endangering the future welfare of people and the planet.
Sustainable development as applied to energy and environment should consider the following:
¢ Inputs - such as fuels and energy sources, land and raw materials - are non-renewable they should be used up only as far as they can be substituted in future
¢ Where they are renewable they should be used up at a rate within which they can be renewed,
¢ Outputs - in production and consumption - should not overstrain ecosystems or the assimilation capacity of the ecosphere.
------------------------
Chapter 11